
Default Prediction in a Structurally Transformed Credit Market
Something fundamental has changed in credit markets

The models we rely on to predict defaults — the Merton distance-to-default framework, the KMV probability of default, the Altman Z-Score and its successors — were built for a world that no longer exists. They were genuine intellectual achievements, and the empirical record accumulated across four decades was real. But the credit market has undergone four simultaneous structural transformations, none of which are reversing, and their cumulative effect on model reliability has been severe.
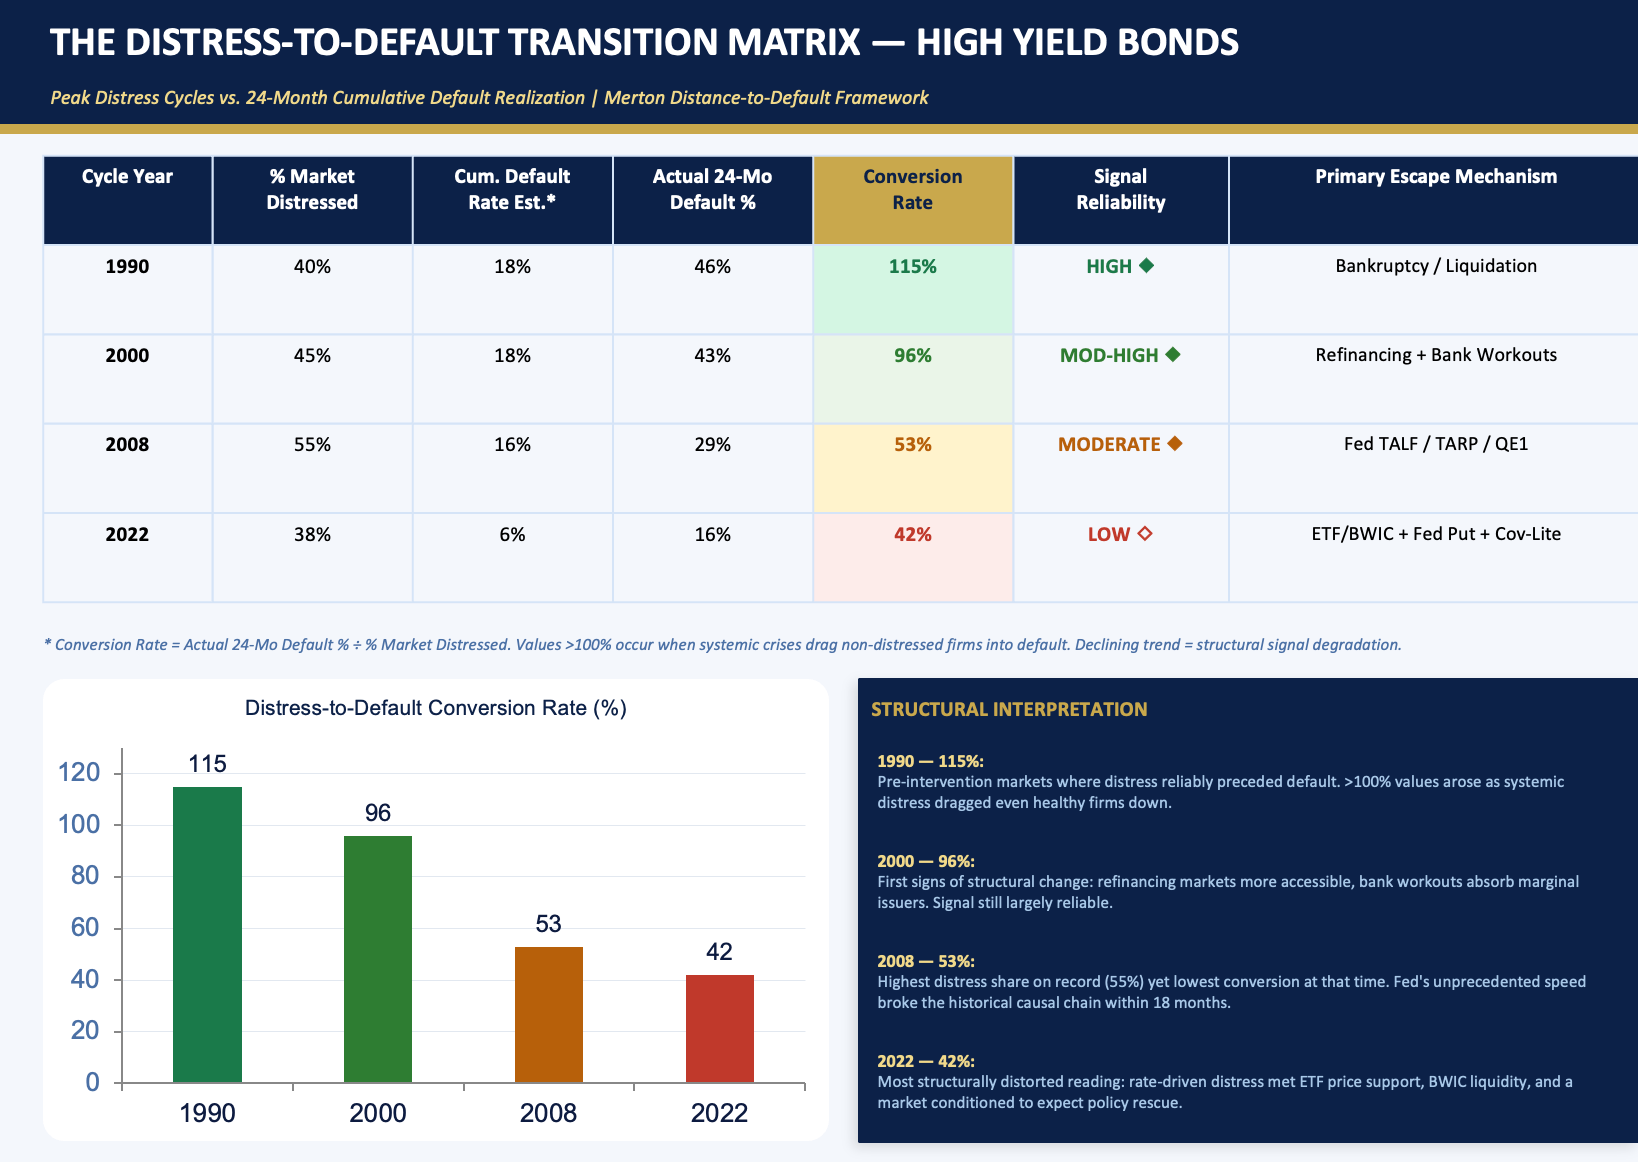
The headline number: the distress-to-default conversion rate has collapsed from 115% in 1990 to 42% in 2022 — a 73 percentage-point structural decline, not a cyclical fluctuation. The models generate false positive distress signals at a rate that renders them unreliable as standalone tools. And that is only the beginning of the problem.
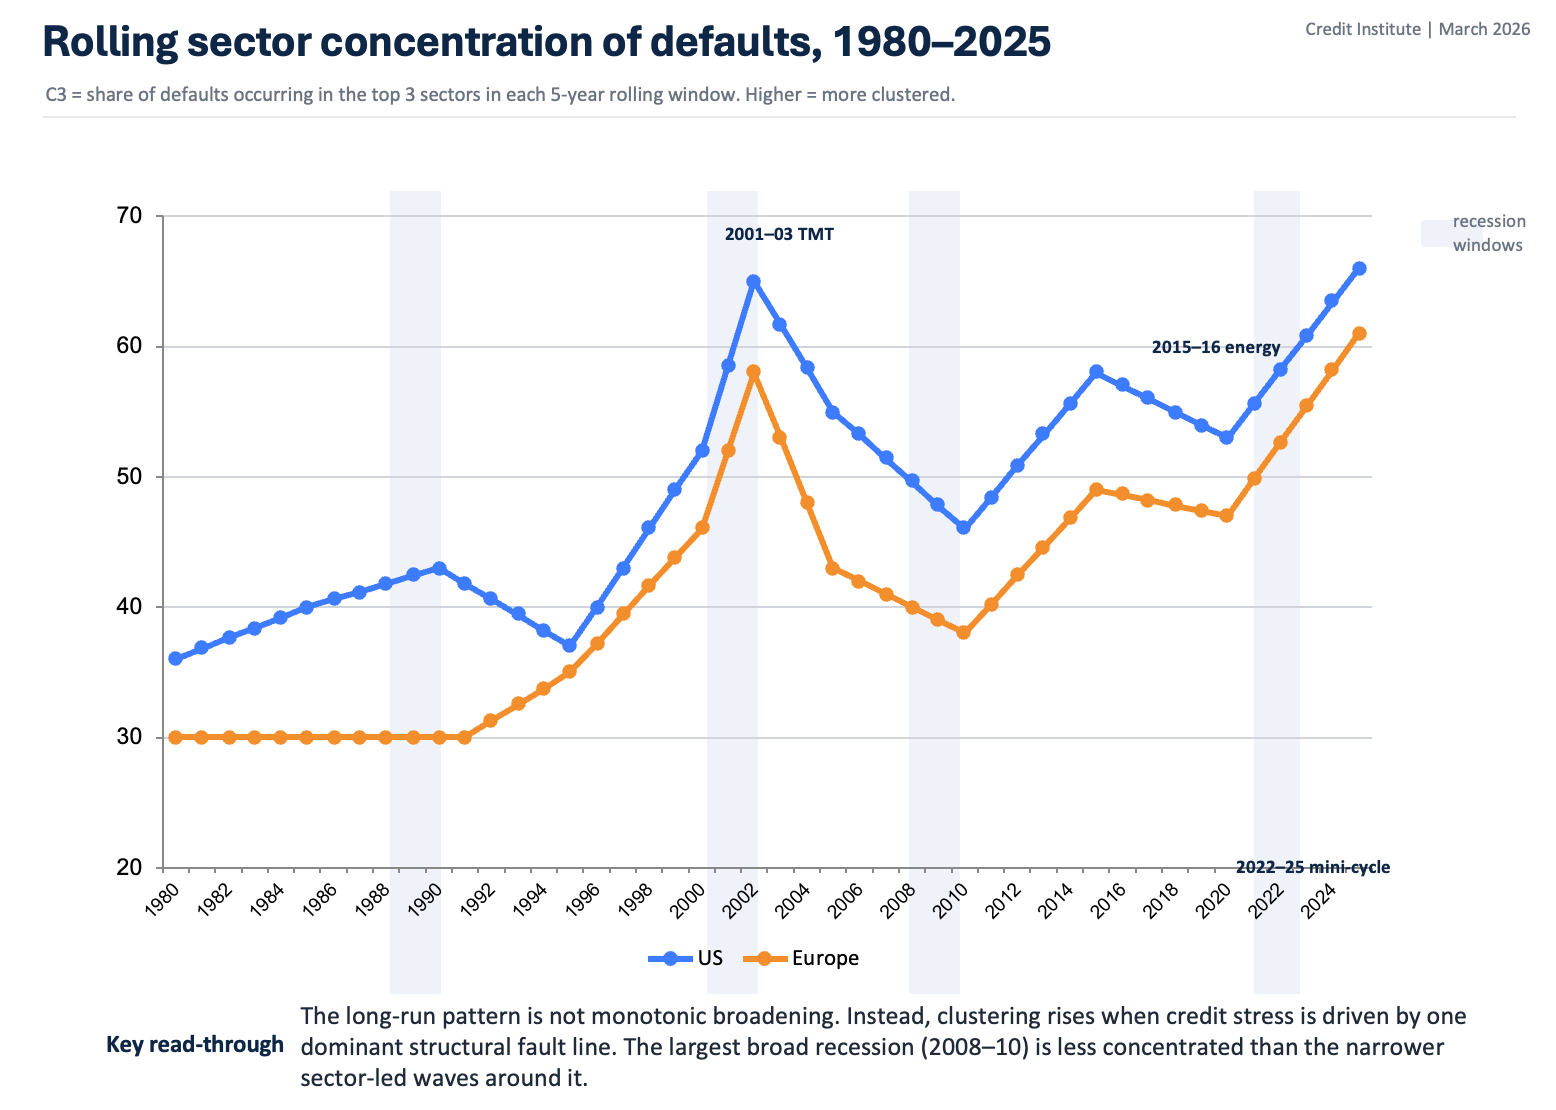
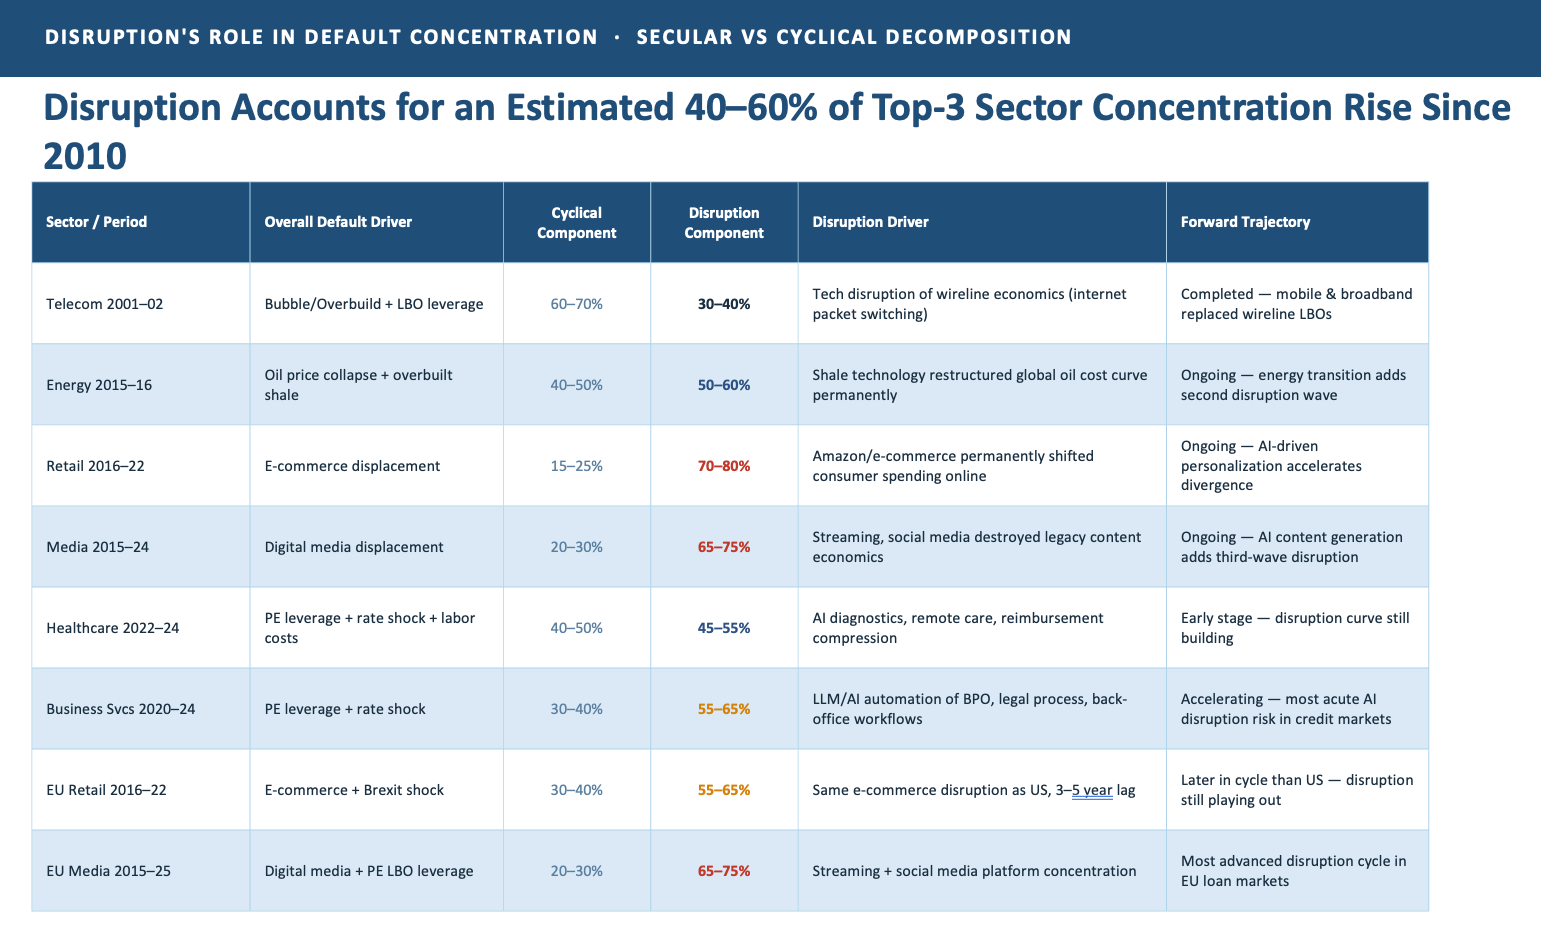
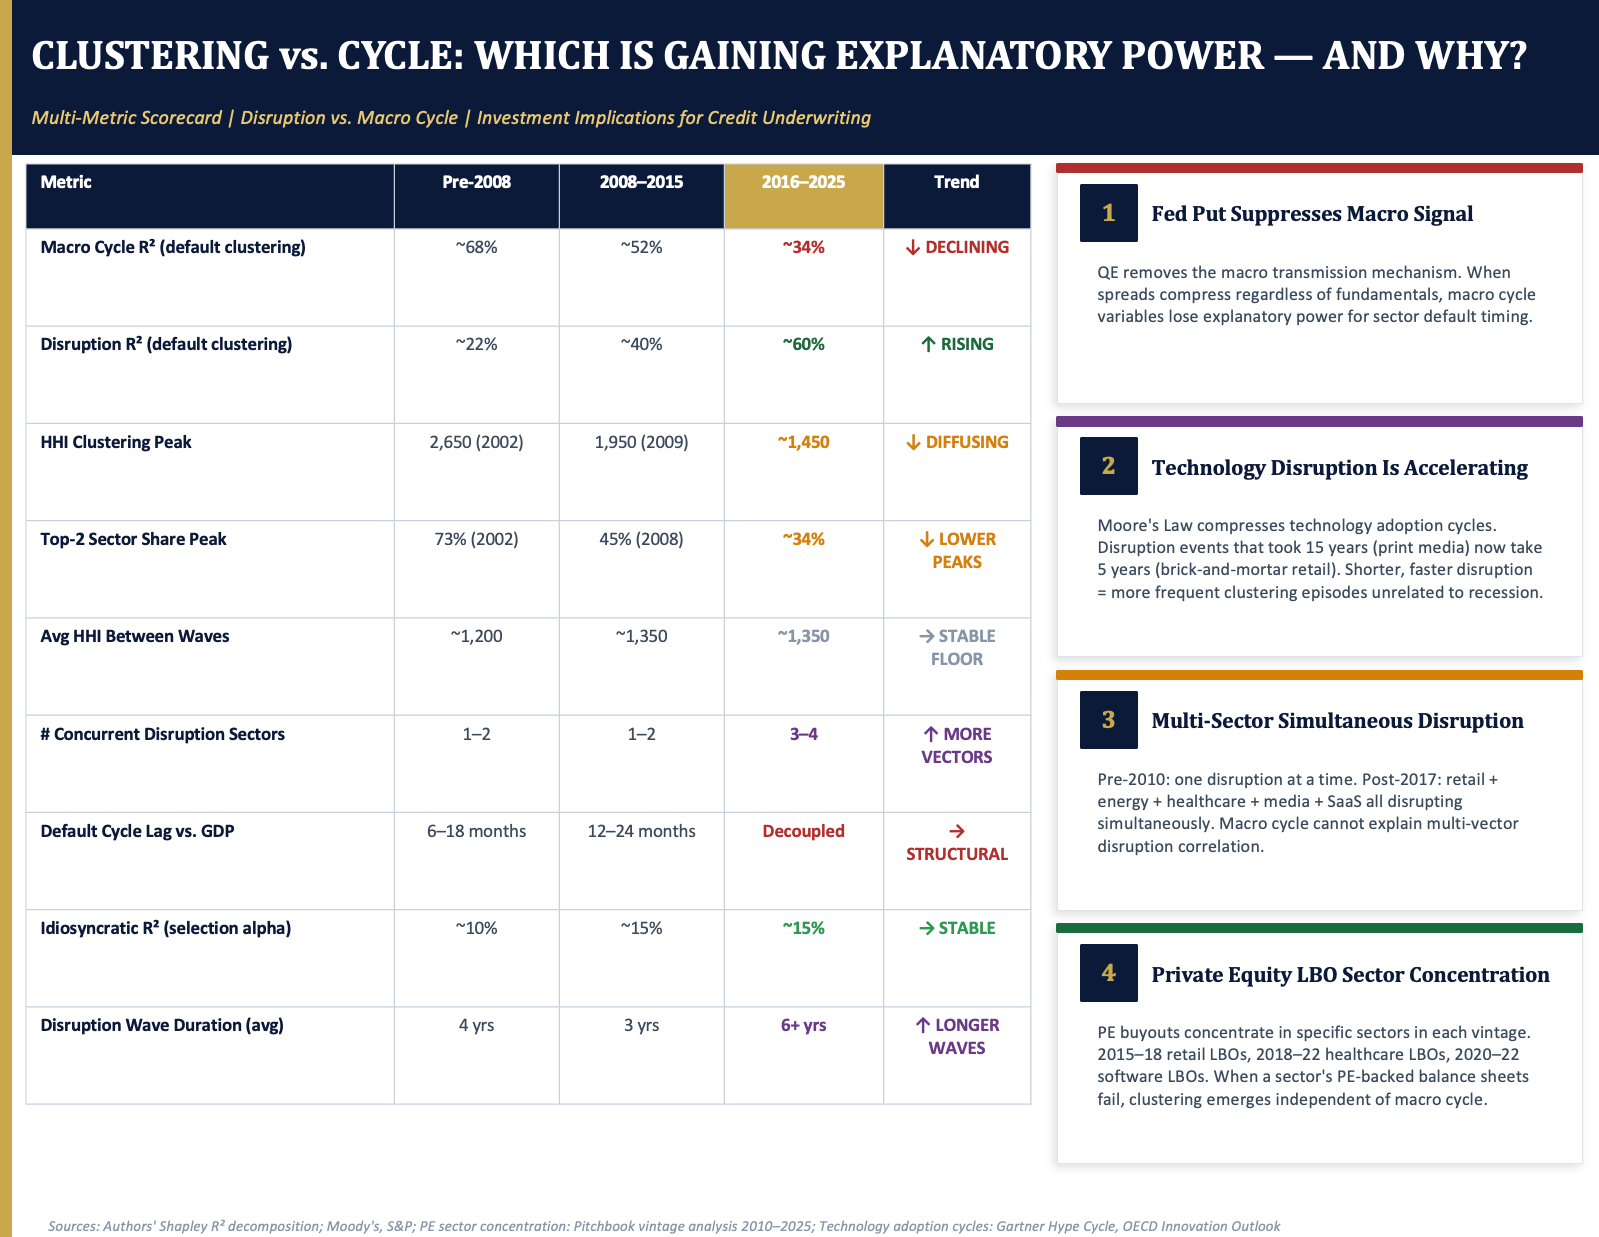
The top three sectors now account for 58–66% of all high yield defaults on a five-year rolling basis, up from roughly 45% in the mid-1990s, and the composition has shifted decisively from cyclical to disruption-driven. The statistical signature of disruption-driven defaults is fundamentally different from anything the traditional models were designed to capture. This piece lays out the diagnostic, the evidence, and the augmented framework we believe the market needs.
Part I: The Three Structural Overrides. We are not describing a tighter rate environment or a credit cycle. We are describing a permanent reconfiguration of credit market plumbing.
The Federal Reserve became a dominant actor. Its balance sheet grew from $870 billion in 2006 to nearly $9 trillion by 2022. What matters is not the size but the behavioral consequence. From TALF/TARP through QE2 and QE3 (which compressed HY spreads ~300bps), and culminating in the 2020 SMCCF’s unprecedented direct purchase of corporate bonds and HY ETFs, the Fed created a structural environment in which distressed issuers now rationally price the probability of policy rescue. Spreads carry an embedded intervention prior. Distressed management teams navigate toward the refinancing window rather than resolution. The causal chain Merton assumed — distress leads to default — has been systematically interrupted.
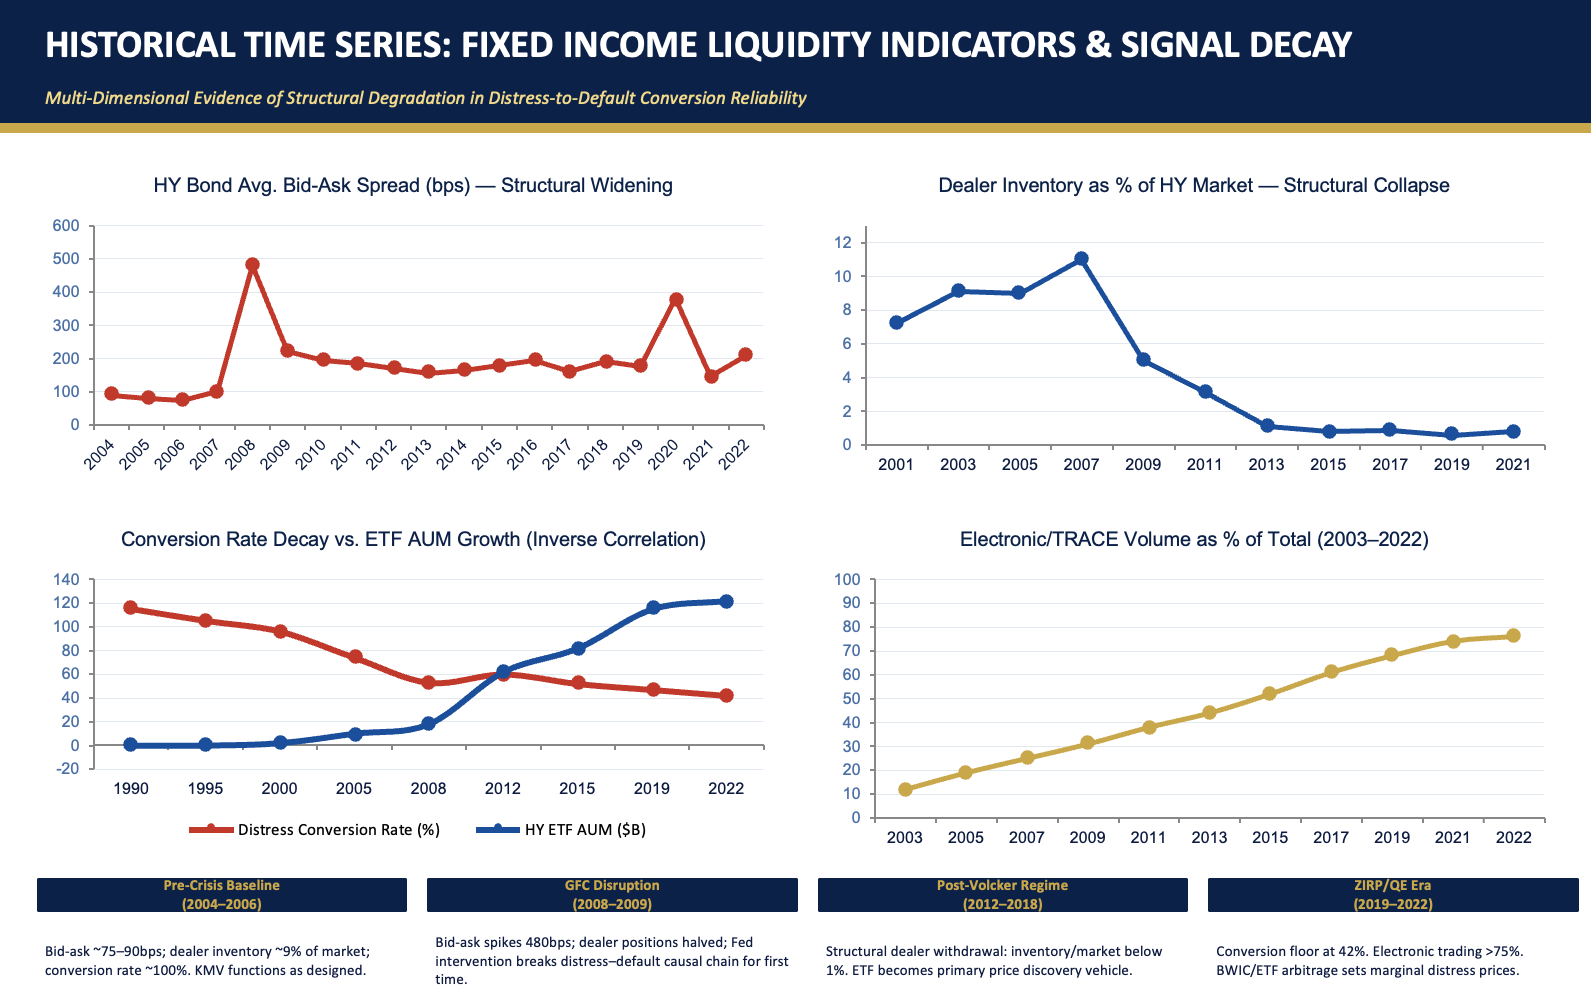
The dealer community exited market-making at an industrial scale. Primary dealers held positions representing 11% of the HY market in 2007. By 2014, that ratio had collapsed to 0.9%and has remained there. Dodd-Frank’s Volcker Rule, Basel III’s NSFR/LCR requirements, the supplementary leverage ratio, and FRTB treatment collectively made HY inventory economically prohibitive. With less than 1% inventory coverage, dealers cannot absorb selling pressure. Bid-ask spreads averaged 75–90 basis points pre-crisis and have settled at 145–210 basis points structurally. The Merton model interprets this spread noise as a fundamental default signal. Increasingly, it is market plumbing.
ETFs and BWIC processes displaced single-security price discovery. HY ETF AUM grew from zero in 2000 to over $120 billion by 2022. BIS research (2022) documents that ETF prices now lead underlying bond prices in 73% of intraday stress episodes — the causal arrow has inverted. When distress registers at the basket level, Authorized Participant arbitrage, CLO reinvestment, and ETF creation activity delay individual-issuer default signals by 6–18 months beyond what fundamentals would predict. The “shadow index effect” is the natural consequence of market participants optimizing around the ETF structure, not a temporary distortion.
Research by Bao, Pan, and Wang (2011) established that the illiquidity bid-ask component explains up to 50% of yield spread variation — unrelated to fundamental credit quality. A rough decomposition of current HY spreads suggests roughly 40% reflects expected default loss (the component Merton captures), 25% reflects uncertainty risk premium, and 35% reflects structural illiquidity premium that is market-architecture-driven. In stress —exactly when default prediction matters most — the illiquidity component inflates, Merton-implied PDs rise, but actual defaults may not follow. The model reads the noise as a signal.
The KMV/Merton framework has not failed. It has been structurally overridden by policy, microstructure change, and the financialization of distress itself.
Part V: The Augmentation Case — What the Z-Score Got Right, and What It Needs
The Altman Z-Score, the Merton distance-to-default, and KMV are not obsolete. Their core insights — leverage kills, volatility signals risk, coverage ratios matter —remain valid for the cyclically and leverage-driven portion of the default universe. The parallel to equity factor models is instructive. When the CAPM proved inadequate to explain the cross-section of equity returns, the response was not to discard it but to augment it: Fama-French added size and value; momentum, quality, and low-volatility followed. Each augmentation retained prior insights while adding explanatory power for the variance that the prior framework could not explain. The Zeta-Score leverage framework was not invalidated by structural market change — it was circumvented for a growing portion of the default population. The response is the same: augmentation, not replacement.
Four additions are necessary:
A liquidity regime variable. The dealer inventory-to-market ratio (below 1% since 2014) should enter default models as a state variable modulating conversion probability from distress signal to actual default. Adrian et al. (2017) established that dealer balance sheet constraints explain 40–60% of bond return variation in stress — a contribution exceeding fundamental credit factors. A model that ignores this discards the most powerful available predictor of signal reliability.
A policy intervention prior. The evidence is overwhelming that market participants price intervention probability above the ~30% distress threshold. This is not an exogenous tail event — it is an endogenous behavioral feature of the modern credit market. It needs to enter default models as a calibrated prior updated on observable indicators (Fed communication, macro conditions, systemic stress), not treated as a shock.
A covenant density score for leveraged loans. With 76% of new leveraged loan issuance covenant-lite, the early-warning tripwire that historically converted distress to detected default 12–18 months before cash non-payment has been structurally removed. A covenant density score should modify the distance-to-default calculation for leveraged credits, effectively restoring the early warning signal that covenant-lite structures have disabled.
A disruption factor. The Disruption-Augmented Probability of Default (DA-PD) framework should incorporate a sector-level Disruption Pipeline Indicator (DPI) capturing each issuer’s exposure to the secular forces reshaping competitive economics. For disruption-exposed credits, the model’s PD should be adjusted upward and the detection horizon extended from 12–18 months to 3–4 years, reflecting the monotonic decay trajectory that characterizes disruption-driven default.
Part VI: The Distribution Has Changed — New Mathematics Required
Traditional default models assume approximate independence of default events conditional on macro conditions — the standard binomial probability framework. This was serviceable when defaults were primarily cyclical. The market now operates with three distinct default distributions simultaneously, requiring different mathematical treatment.
Cyclical/leverage-driven defaults continue to approximate the binomial framework — albeit with conversion probability discounted by the four structural overrides. These remain detectable at 12–18 months using augmented traditional models.
Disruption-driven defaults follow a bimodal distribution within affected sectors. The issuer population bifurcates between adaptors and non-adaptors; the separation widens monotonically. The tail of non-adaptors does not normalize — it thins as bankruptcies accumulate while the surviving population increasingly concentrates in the deep-default zone. Models that assume a symmetric distribution around a sector mean will systematically misclassify credits in both tails.
Self-reinforcing concentration dynamics increasingly resemble a power distribution. Once a sector exceeds approximately 20% of five-year rolling default share, concentration risk rises super-linearly: concentrated defaults signal sector risk → credit availability in that sector contracts → weaker firms cannot refinance → more defaults → deeper concentration. This feedback loop produced a 2–3 year reinforcing default tail after every major sector bust in our data. It is not captured by any standard default prediction framework and requires systemic sector-level treatment, not aggregation of individual issuer probabilities.
The transition from a binomial to a bimodal and increasingly power-distributed default world explains why concentration has not reverted to pre-2000 levels across multiple credit cycles, why disruption-driven sector defaults remain elevated long after cyclical conditions normalize, and why aggregate rating agency default statistics — pooling all default types under a single rate — increasingly obscure than they reveal.
Conclusion: From CAPM to Multi-Factor — Credit’s Necessary Evolution
The equity market lived through exactly this inflection. The CAPM offered an elegant single-factor framework that worked until the anomalies accumulated — small-cap and value premiums, momentum, and quality. The response was augmentation, not replacement: Fama-French, then a succession of additional factors. Today, institutional equity management is built on multi-factor frameworks that retain beta as a foundation while adding what the single-factor model could not explain.
Credit default modeling is at the equivalent moment. The Z-Score was the CAPM equivalent —leverage and coverage as the primary factors, valid in a world where defaults were cyclically driven, and markets functioned as designed. The Merton/KMV framework added equity market information, just as CAPM’s successors added market-priced signals. The structural transformation in credit markets — the four overrides that collapsed conversion rates, the rise of disruption as a default driver, the shift in statistical distributions — is the precise analog of the cross-sectional anomalies that forced equity model evolution.
The credit market’s anomalies are now quantifiable:
The distress-to-default conversion rate has declined 73 percentage points since 1990; the residual after accounting for cyclical factors is structural and permanent.
Default concentration has risen persistently across every credit era with no reversion, driven by forces traditional models treat as noise.
The disruption component of leading sector default events now ranges from 45% to 80%and is accelerating.
The detection window for the fastest-growing category of defaults is 3–4 years, not 12–18months.
The augmented framework — retaining the leverage-based Z-Score, the market-based Merton signal, and fundamental coverage analytics as foundational factors, while adding liquidity regime variables, policy intervention priors, covenant density scoring, and a disruption factor — is the credit market equivalent of the multi-factor model. It is not a repudiation of what came before. It is the natural evolution demanded by evidence.
The credit market of 2026 is structurally unrecognizable from the one in which the foundational models were developed: a central bank balance sheet 10 times pre-crisis levels, dealer inventory below 1% of market size, ETF prices that lead bond price discovery, 76% covenant-lite loan issuance. A distress-to-default conversion rate of 42% is not a puzzle in this context. It is a precise measurement of structural override at scale.
The signal has not failed. The market has changed around it. Just as equity factor models evolved to reflect the structural realities of modern equity markets, so too must default drivers reflect the structural shifts in credit. The models that do not are systematically mischaracterizing risk across a growing share of portfolios — and the cost of that mischaracterization compounds every year as the disruption-driven default share grows.
Private Credit Analytics Institute (PCAI) conducts fundamental quantitative research on private credit, leveraged finance, and disruption-augmented default analytics. Proprietary frameworks referenced include the Disruption Pipeline Indicator (DPI), the Disruption-Augmented Probability of Default (DA-PD), and the zombie corridor concept